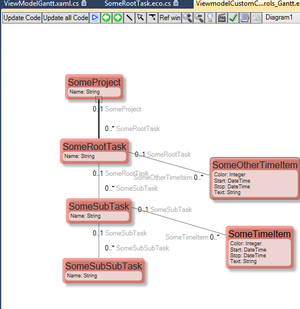
A simple model to hold the data:
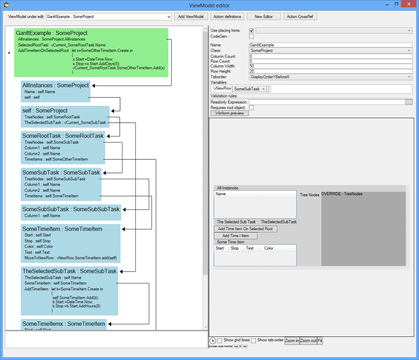
Then, a ViewModel can show and create data defined by that model:
I hook up the newly created Gantt-wrapper that has this text to describe its requirements:
A list column with name TreeNodes.
Each TreeNode should have Column1 and Column2 to display in grid
TreeNodes can also have an association TimeItems; each TimeItem should have Start,Stop(DateTime), Text(string),Color(int)
TreeNodes can also have a association TreeNodes to sub TreeNodes; these tree nodes should also have Column1,2, and TimeItems
To allow for a TimeItem to move from one row to another add an Action column on TimeItem named MoveToNewRow, also declare viewmodel variable vNewRow of the type your class representing the TimeItem has
Can then implement the move in the Action execute expression; vNewRow.SomeTimeItem.add(self)
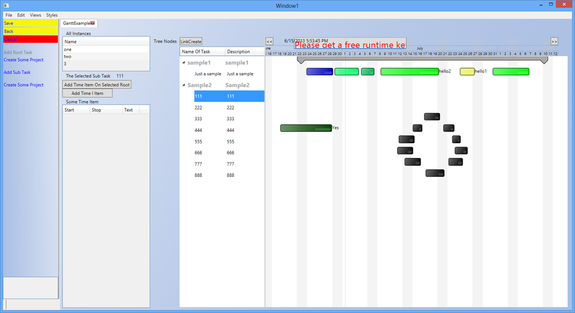
We need to read and understand to make our ViewModel fit the need of the rather complex UI control. If we follow these guidelines, we get data shown in the control – bound by WPF-databinding:
We can do things like select and move, resize, switch rows, edit texts in the tree, etc.
The Gantt control also supports Windows 8 gestures.
To find out how to create overrides and components in AngularJS, look here.


